请注意,本文编写于 185 天前,最后修改于 185 天前,其中某些信息可能已经过时。
目录
简介
ScottPlot是一个强大的.NET图表库,可以用来创建各种类型的图表。本文将详细介绍如何使用ScottPlot创建堆叠图(分组柱状图)。
基本实现步骤
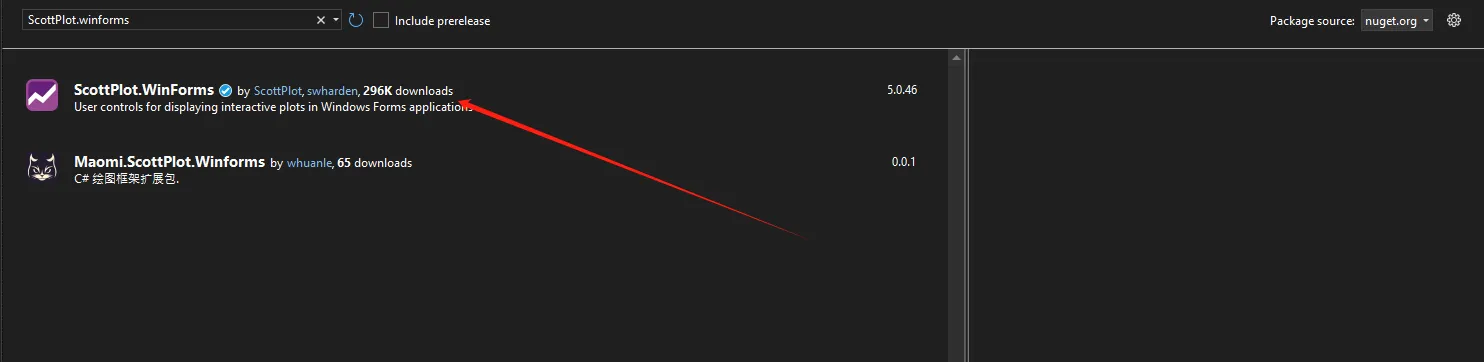
nuget 安装ScottPlot.winforms
1. 创建Plot对象
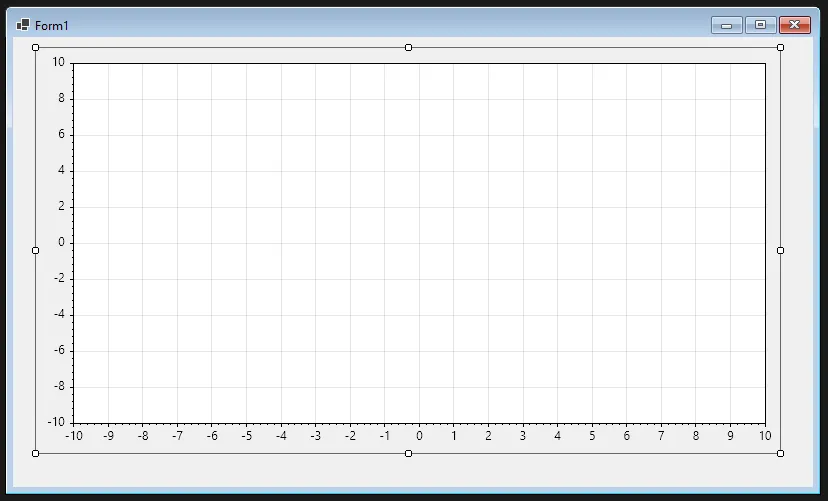
首先需要创建一个Plot对象,这是所有图表的基础:
C#ScottPlot.Plot myPlot = formsPlot1.Plot;
2. 设置调色板
ScottPlot提供了多种内置调色板,这里使用Category10调色板:
C#ScottPlot.Palettes.Category10 palette = new();
3. 创建数据
创建Bar数组来存储柱状图的数据。每个Bar对象包含以下属性:
- Position: 柱子的位置
- Value: 柱子的高度
- FillColor: 填充颜色
- Error: 误差值(可选)
C#ScottPlot.Bar[] bars = {
    // 第一组
    new() { Position = 1, Value = 2, FillColor = palette.GetColor(0), Error = 1 },
    new() { Position = 2, Value = 5, FillColor = palette.GetColor(1), Error = 2 },
    new() { Position = 3, Value = 7, FillColor = palette.GetColor(2), Error = 1 },

    // 第二组
    new() { Position = 5, Value = 4, FillColor = palette.GetColor(0), Error = 2 },
    new() { Position = 6, Value = 7, FillColor = palette.GetColor(1), Error = 1 },
    new() { Position = 7, Value = 13, FillColor = palette.GetColor(2), Error = 3 },

    // 第三组
    new() { Position = 9, Value = 5, FillColor = palette.GetColor(0), Error = 1 },
    new() { Position = 10, Value = 6, FillColor = palette.GetColor(1), Error = 3 },
    new() { Position = 11, Value = 11, FillColor = palette.GetColor(2), Error = 2 },
};
4. 添加柱状图
将创建的bars数组添加到Plot对象中:
C#myPlot.Add.Bars(bars);
5. 配置图例
设置图例的显示和位置:
C#myPlot.Legend.IsVisible = true;
myPlot.Legend.Alignment = Alignment.UpperLeft;

// 手动添加图例项
myPlot.Legend.ManualItems.Add(new() { LabelText = "Monday", FillColor = palette.GetColor(0) });
myPlot.Legend.ManualItems.Add(new() { LabelText = "Tuesday", FillColor = palette.GetColor(1) });
myPlot.Legend.ManualItems.Add(new() { LabelText = "Wednesday", FillColor = palette.GetColor(2) });
6. 设置X轴标签
为分组添加标签:
C#Tick[] ticks = {
    new(2, "Group 1"),
    new(6, "Group 2"),
    new(10, "Group 3"),
};
myPlot.Axes.Bottom.TickGenerator = new ScottPlot.TickGenerators.NumericManual(ticks);
myPlot.Axes.Bottom.MajorTickStyle.Length = 0;
7. 其他样式设置
C#// 隐藏网格
myPlot.HideGrid();

// 设置底部边距
myPlot.Axes.Margins(bottom: 0);
8. 保存或显示图表
C#// 保存为图片
myPlot.SavePng("demo.png", 400, 300);

// 如果在Windows Forms中使用
formsPlot1.Refresh();
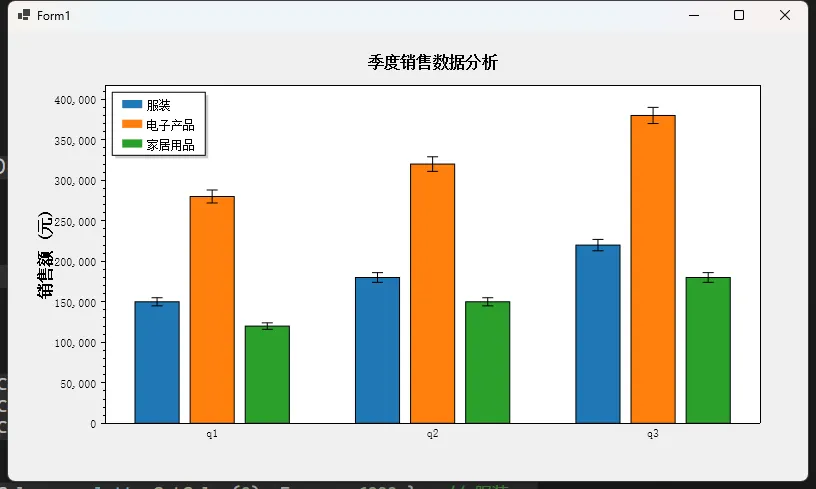
示例一
C#using ScottPlot;

namespace AppScottPlot
{
    public partial class Form1 : Form
    {
        public Form1()
        {
            InitializeComponent();
        }

        private void Form1_Load(object sender, EventArgs e)
        {
            ScottPlot.Plot myPlot = formsPlot1.Plot;
            myPlot.Font.Set("SimSun");
            // 设置调色板
            ScottPlot.Palettes.Category10 palette = new();

            // 创建销售数据
            ScottPlot.Bar[] salesBars = {
                // 第一季度销售数据
                new() { Position = 1, Value = 150000, FillColor = palette.GetColor(0), Error = 5000 },  // 服装
                new() { Position = 2, Value = 280000, FillColor = palette.GetColor(1), Error = 8000 },  // 电子
                new() { Position = 3, Value = 120000, FillColor = palette.GetColor(2), Error = 4000 },  // 家居

                // 第二季度销售数据
                new() { Position = 5, Value = 180000, FillColor = palette.GetColor(0), Error = 6000 },  // 服装
                new() { Position = 6, Value = 320000, FillColor = palette.GetColor(1), Error = 9000 },  // 电子
                new() { Position = 7, Value = 150000, FillColor = palette.GetColor(2), Error = 5000 },  // 家居

                // 第三季度销售数据
                new() { Position = 9, Value = 220000, FillColor = palette.GetColor(0), Error = 7000 },  // 服装
                new() { Position = 10, Value = 380000, FillColor = palette.GetColor(1), Error = 10000 }, // 电子
                new() { Position = 11, Value = 180000, FillColor = palette.GetColor(2), Error = 6000 },  // 家居
            };

            // 添加柱状图
            myPlot.Add.Bars(salesBars);

            // 配置图例
            myPlot.Legend.IsVisible = true;
            myPlot.Legend.Alignment = Alignment.UpperLeft;
            myPlot.Legend.ManualItems.Add(new() { LabelText = "服装", FillColor = palette.GetColor(0) });
            myPlot.Legend.ManualItems.Add(new() { LabelText = "电子产品", FillColor = palette.GetColor(1) });
            myPlot.Legend.ManualItems.Add(new() { LabelText = "家居用品", FillColor = palette.GetColor(2) });

            // 设置季度标签
            Tick[] ticks = {
                new(2, "q1"),
                new(6, "q2"),
                new(10, "q3"),
            };
            myPlot.Axes.Bottom.TickGenerator = new ScottPlot.TickGenerators.NumericManual(ticks);
            myPlot.Axes.Bottom.MajorTickStyle.Length = 0;

            // 设置Y轴标签格式(显示为"100k"形式)
            myPlot.Axes.Left.Label.Text = "销售额 (元)";

            // 设置标题
            myPlot.Title("季度销售数据分析",16);

            // 隐藏网格并设置边距
            myPlot.HideGrid();
            myPlot.Axes.Margins(bottom: 0);


            formsPlot1.Refresh();
        }
    }
}
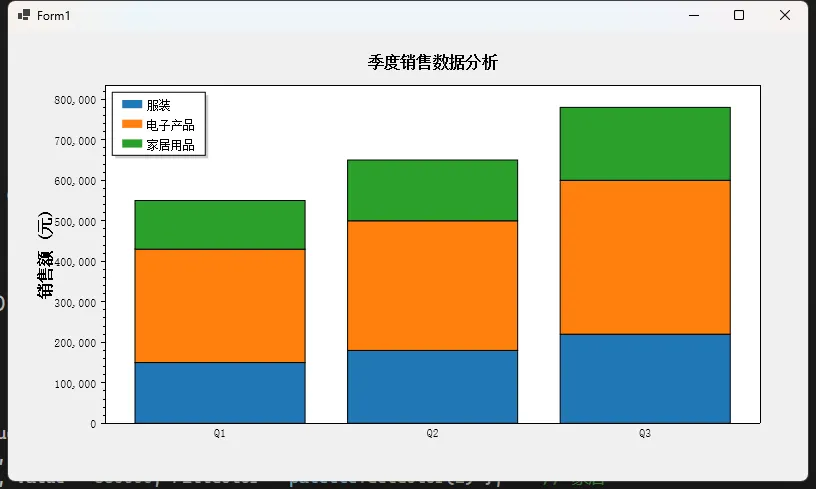
示例二
C#using ScottPlot;

namespace AppScottPlot
{
    public partial class Form1 : Form
    {
        public Form1()
        {
            InitializeComponent();
        }

        private void Form1_Load(object sender, EventArgs e)
        {
            ScottPlot.Plot myPlot = formsPlot1.Plot;
            myPlot.Font.Set("SimSun");
            // 设置调色板
            ScottPlot.Palettes.Category10 palette = new();

            // 创建堆叠柱状图数据
            ScottPlot.Bar[] bars =
            {
                // 第一季度堆叠柱状图
                new() { Position = 1, ValueBase = 0, Value = 150000, FillColor = palette.GetColor(0) },         // 服装
                new() { Position = 1, ValueBase = 150000, Value = 430000, FillColor = palette.GetColor(1) },    // 电子
                new() { Position = 1, ValueBase = 430000, Value = 550000, FillColor = palette.GetColor(2) },    // 家居

                // 第二季度堆叠柱状图
                new() { Position = 2, ValueBase = 0, Value = 180000, FillColor = palette.GetColor(0) },         // 服装
                new() { Position = 2, ValueBase = 180000, Value = 500000, FillColor = palette.GetColor(1) },    // 电子
                new() { Position = 2, ValueBase = 500000, Value = 650000, FillColor = palette.GetColor(2) },    // 家居

                // 第三季度堆叠柱状图
                new() { Position = 3, ValueBase = 0, Value = 220000, FillColor = palette.GetColor(0) },         // 服装
                new() { Position = 3, ValueBase = 220000, Value = 600000, FillColor = palette.GetColor(1) },    // 电子
                new() { Position = 3, ValueBase = 600000, Value = 780000, FillColor = palette.GetColor(2) },    // 家居
            };

            // 添加堆叠柱状图
            myPlot.Add.Bars(bars);

            // 配置图例
            myPlot.Legend.IsVisible = true;
            myPlot.Legend.Alignment = Alignment.UpperLeft;
            myPlot.Legend.ManualItems.Add(new() { LabelText = "服装", FillColor = palette.GetColor(0) });
            myPlot.Legend.ManualItems.Add(new() { LabelText = "电子产品", FillColor = palette.GetColor(1) });
            myPlot.Legend.ManualItems.Add(new() { LabelText = "家居用品", FillColor = palette.GetColor(2) });

            // 设置季度标签
            Tick[] ticks = {
                new(1, "Q1"),
                new(2, "Q2"),
                new(3, "Q3"),
            };
            myPlot.Axes.Bottom.TickGenerator = new ScottPlot.TickGenerators.NumericManual(ticks);
            myPlot.Axes.Bottom.MajorTickStyle.Length = 0;

            // 设置Y轴标签
            myPlot.Axes.Left.Label.Text = "销售额 (元)";

            // 设置标题
            myPlot.Title("季度销售数据分析", 16);

            // 隐藏网格并设置边距
            myPlot.HideGrid();
            myPlot.Axes.Margins(bottom: 0);

            formsPlot1.Refresh();
        }
    }
}
实际应用场景
这种堆叠图特别适合用于:
- 比较不同类别在不同组别下的数据
- 展示时间序列数据的多个维度
- 展示销售数据的不同产品类别
- 分析不同时期的数据分布
总结
ScottPlot提供了灵活且强大的API来创建堆叠图。通过合理配置Position和分组,可以创建出清晰易读的数据可视化图表。配合颜色、图例和标签的设置,能够制作出专业的数据展示效果。
本文作者:rick
本文链接:
版权声明:本博客所有文章除特别声明外,均采用 BY-NC-SA 许可协议。转载请注明出处!
目录