请注意,本文编写于 186 天前,最后修改于 186 天前,其中某些信息可能已经过时。
目录
简介
OxyPlot是一个功能强大的跨平台绘图库,可以在WinForms应用程序中创建各种类型的图表,包括饼状图。本指南将介绍如何在WinForms应用程序中使用OxyPlot创建和自定义饼状图。
环境设置
首先,确保您的WinForms项目中已安装OxyPlot库。您可以通过NuGet包管理器安装:
C#Install-Package OxyPlot.WindowsForms
基本饼状图
让我们从一个简单的饼状图开始:
C#using OxyPlot;
using OxyPlot.Series;
using OxyPlot.WindowsForms;

private void CreateBasicPieChart()
{
    var model = new PlotModel { Title = "基本饼状图" };

    var series = new PieSeries
    {
        StrokeThickness = 2.0,
        InsideLabelPosition = 0.8,
        AngleSpan = 360,
        StartAngle = 0
    };

    series.Slices.Add(new PieSlice("苹果", 3) { IsExploded = true });
    series.Slices.Add(new PieSlice("香蕉", 4));
    series.Slices.Add(new PieSlice("橙子", 2));

    model.Series.Add(series);

    var plotView = new PlotView
    {
        Model = model,
        Dock = DockStyle.Fill
    };

    this.Controls.Add(plotView);
}
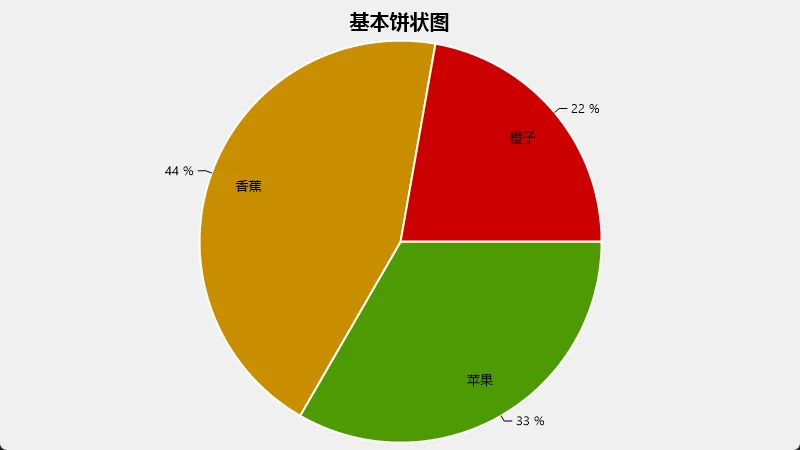
这个例子创建了一个简单的饼状图,显示了三种水果的数量分布。
自定义颜色和标签
我们可以进一步自定义饼图的外观:
C#private void CreateCustomColoredPieChart()
{
    var model = new PlotModel { Title = "自定义颜色饼状图" };

    var series = new PieSeries
    {
        StrokeThickness = 2.0,
        InsideLabelPosition = 0.5,
        AngleSpan = 360,
        StartAngle = 0,
        InsideLabelFormat = "{0}: {1:P1}"
    };

    series.Slices.Add(new PieSlice("红队", 30) { Fill = OxyColors.Red });
    series.Slices.Add(new PieSlice("蓝队", 25) { Fill = OxyColors.Blue });
    series.Slices.Add(new PieSlice("绿队", 20) { Fill = OxyColors.Green });
    series.Slices.Add(new PieSlice("黄队", 15) { Fill = OxyColors.Yellow });
    series.Slices.Add(new PieSlice("紫队", 10) { Fill = OxyColors.Purple });

    model.Series.Add(series);

    var plotView = new PlotView
    {
        Model = model,
        Dock = DockStyle.Fill
    };


    plotView.Model = model;

    this.Controls.Add(plotView);

}
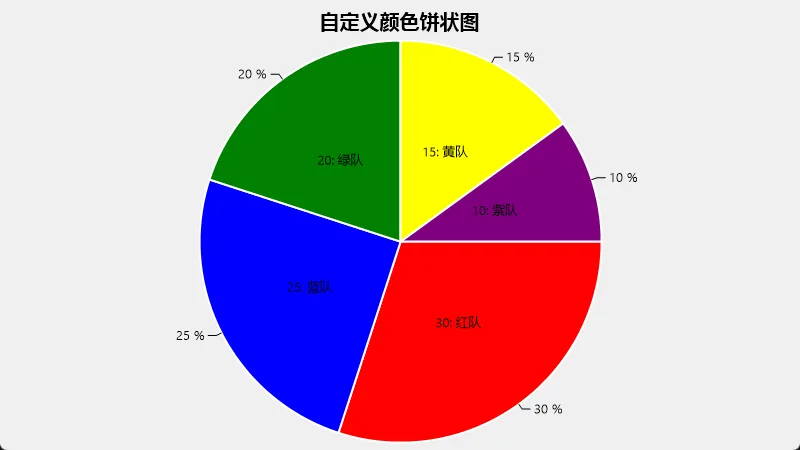
这个例子展示了如何为每个切片设置自定义颜色,并格式化标签以显示百分比。
这个例子创建了一个饼状图,当用户点击某个切片时,会显示一个消息框。
动态更新饼状图
在某些情况下,您可能需要动态更新饼状图的数据:
C#private PieSeries _series;
private PlotModel _model;

private void InitializeDynamicPieChart()
{
    _model = new PlotModel { Title = "动态饼状图" };

    _series = new PieSeries
    {
        StrokeThickness = 2.0,
        InsideLabelPosition = 0.8,
        AngleSpan = 360,
        StartAngle = 0
    };

    _model.Series.Add(_series);

    plotView1.Model = _model;
}

private void UpdatePieChart(Dictionary<string, double> newData)
{
    _series.Slices.Clear();
    foreach (var item in newData)
    {
        _series.Slices.Add(new PieSlice(item.Key, item.Value));
    }
    _model.InvalidatePlot(true);
}

// 使用示例
private void button1_Click(object sender, EventArgs e)
{
    var newData = new Dictionary<string, double>
    {
        { "类别A", 40 },
        { "类别B", 30 },
        { "类别C", 20 },
        { "类别D", 10 }
    };
    UpdatePieChart(newData);
}
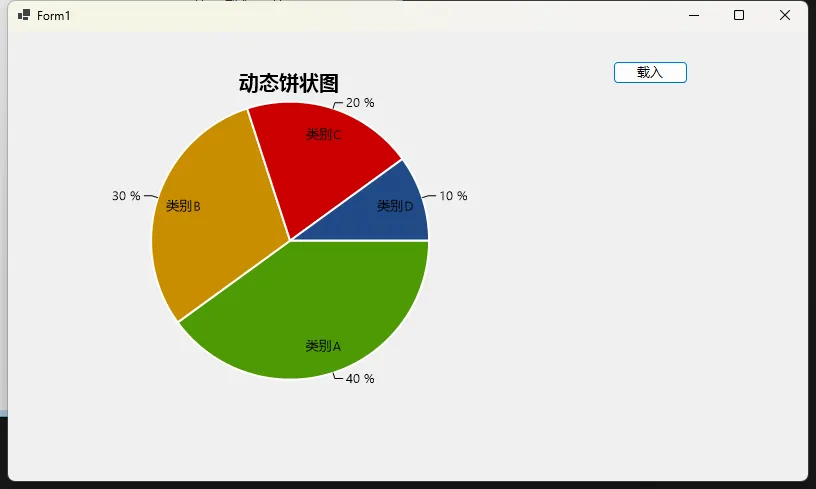
这个例子展示了如何创建一个可以动态更新的饼状图。您可以在需要时调用UpdatePieChart方法来更新图表数据。
结论
OxyPlot为WinForms应用程序提供了强大而灵活的饼状图创建功能。通过本指南中的示例,您可以创建基本的饼状图,自定义其外观,添加交互性,以及动态更新数据。这些技术可以帮助您在应用程序中创建丰富的数据可视化效果。
记住,OxyPlot不仅限于饼状图,它还支持多种其他类型的图表。探索OxyPlot的文档以了解更多可能性,并根据您的具体需求进行定制。
本文作者:rick
本文链接:
版权声明:本博客所有文章除特别声明外,均采用 BY-NC-SA 许可协议。转载请注明出处!
目录