目录
在现代软件开发中,高效的数据管理至关重要。虽然关系型数据库管理系统(如SQL Server)通常是首选解决方案,但在某些简单场景下,我们可能需要一种更轻量级的方法。例如,不需要复杂关系数据库的应用程序可以受益于使用文本文件进行数据存储。这正是我们的电话簿应用程序的情况,它使用简单的2D表格管理数据。
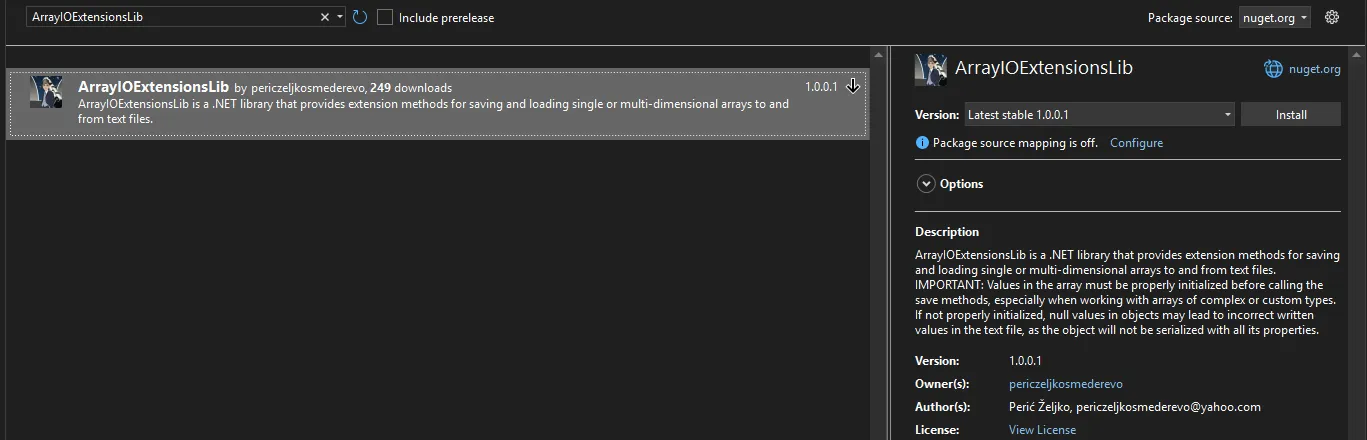
为了简化保存和检索数据的过程,我们开发了ArrayIOExtensionsLib,这是一个提供易于使用的方法来处理存储在文本文件中的数据的库。
ArrayIOExtensionsLib概述
ArrayIOExtensionsLib是一个.NET库,旨在简化使用存储在文本文件中的数组的工作。它提供了扩展方法,用于将简单类型(如字符串和基本类型)的单维和多维数组保存到文本文件中,以及从文本文件中加载这些数组。这个库非常适合不需要关系数据库但仍然需要可靠和高效的数据存储和检索的应用程序。
主要特性
- 保存和加载多维数组:可以将任何维度(1D、2D等)的数组保存到文本文件中,每个元素存储为单独的一行。
- 仅支持简单类型:适用于字符串、基本类型(int、double等)数组,以及仅包含简单属性的自定义对象类型。
- 固定长度数组:库使用固定长度数组。程序员必须预估运行时数组将容纳的最大记录数。
- 空值处理:null值在文本文件中序列化为"null",并在反序列化时正确还原到数组中。
- 可自定义编码:允许在保存和加载文件时指定编码(默认为UTF-8)。
安装
要在项目中使用此库,请按照以下步骤操作:
PowerShellNuGet\Install-Package ArrayIOExtensionsLib -Version 1.0.0.1
使用方法
将数组保存到文本文件
C#using ArrayIOExtensionsLib;

namespace AppArrayIOExtensionsLib
{
    internal class Program
    {
        static void Main(string[] args)
        {
            string[,] phoneBook = new string[100, 4];
            // 填充phoneBook数组...
            phoneBook.SaveToTextFile("phonebook.txt");
            Console.ReadKey();
        }
    }
}
从文本文件加载数组
C#string[,] loadedPhoneBook = new string[100, 4];
loadedPhoneBook.LoadFromTextFile("phonebook.txt");
保存自定义类型
C#using ArrayIOExtensionsLib;

namespace AppArrayIOExtensionsLib
{
    public class Person
    {
        public string Name { get; set; }
        public int Age { get; set; }
    }


    internal class Program
    {
        static void Main(string[] args)
        {
            Person[] people = new Person[50];
            // 填充people数组...
            people.SaveToTextFile("people.txt");

            Console.ReadKey();
        }
    }
}
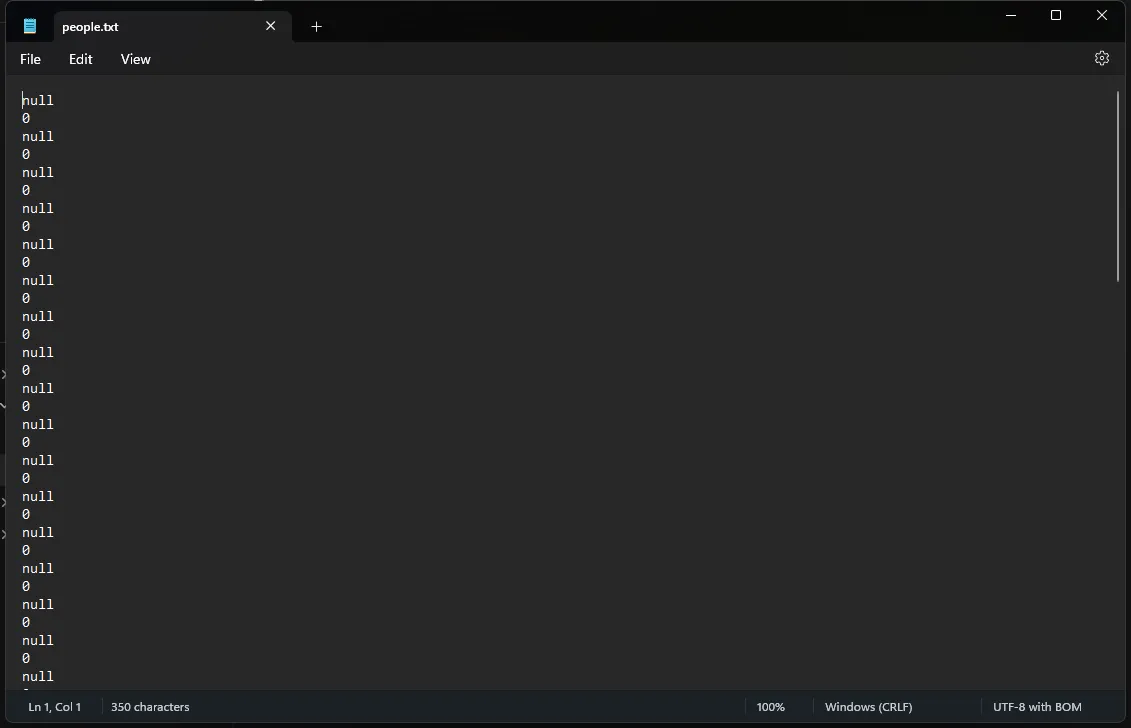
加载自定义类型
C#Person[] loadedPeople = new Person[50];
loadedPeople.LoadFromTextFile("people.txt");
电话簿应用程序示例
C#using System;
using System.Collections.Generic;
using System.Linq;
using System.Text;
using System.Threading.Tasks;

namespace AppPhoneBook
{
    public class PhoneBookEntry
    {
        public string FirstName { get; set; }
        public string LastName { get; set; }
        public string PhoneNumber { get; set; }
        public string Address { get; set; }
    }
}
让我们看一个更详细的电话簿应用程序示例,展示如何使用ArrayIOExtensionsLib:
C#using ArrayIOExtensionsLib;

namespace AppPhoneBook
{

    public partial class Form1 : Form
    {
        private PhoneBookEntry[] phoneBook;
        private const string FILE_PATH = "phonebook.txt";
        private const int MAX_ENTRIES = 100;
        public Form1()
        {
            InitializeComponent();
            phoneBook = new PhoneBookEntry[MAX_ENTRIES];
            listViewContacts.Columns.Add("First Name");
            listViewContacts.Columns.Add("Last Name");
            listViewContacts.Columns.Add("Phone Number");
            listViewContacts.Columns.Add("Address");
            listViewContacts.FullRowSelect = true;
            listViewContacts.GridLines = true;
            LoadPhoneBook();
        }

        private void LoadPhoneBook()
        {
            try
            {
                phoneBook.LoadFromTextFile(FILE_PATH);
                RefreshListView();
            }
            catch (Exception ex)
            {
                MessageBox.Show($"Error loading phone book: {ex.Message}");
            }
        }

        private void SavePhoneBook()
        {
            try
            {
                phoneBook.SaveToTextFile(FILE_PATH);
                MessageBox.Show("Phone book saved successfully.");
            }
            catch (Exception ex)
            {
                MessageBox.Show($"Error saving phone book: {ex.Message}");
            }
        }

        private void RefreshListView()
        {
            listViewContacts.Items.Clear();
            foreach (var entry in phoneBook)
            {
                if (entry != null)
                {
                    ListViewItem item = new ListViewItem(new[] { entry.FirstName, entry.LastName, entry.PhoneNumber, entry.Address });
                    listViewContacts.Items.Add(item);
                }
            }
        }

        private void btnAdd_Click(object sender, EventArgs e)
        {
            int index = Array.FindIndex(phoneBook, entry => entry == null);
            if (index == -1)
            {
                MessageBox.Show("Phone book is full.");
                return;
            }

            phoneBook[index] = new PhoneBookEntry
            {
                FirstName = txtFirstName.Text,
                LastName = txtLastName.Text,
                PhoneNumber = txtPhoneNumber.Text,
                Address = txtAddress.Text
            };

            RefreshListView();
            ClearInputFields();
        }

        private void btnSave_Click(object sender, EventArgs e)
        {
            SavePhoneBook();
        }

        private void ClearInputFields()
        {
            txtFirstName.Clear();
            txtLastName.Clear();
            txtPhoneNumber.Clear();
            txtAddress.Clear();
        }
    }
}
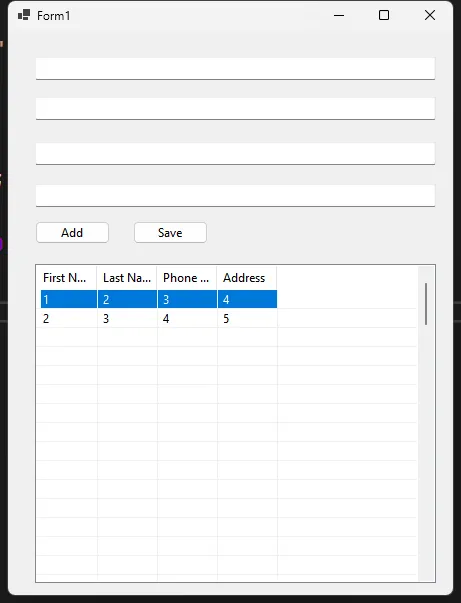
这个示例展示了如何使用ArrayIOExtensionsLib来管理电话簿数据。它使用PhoneBookEntry类来表示每个联系人,并使用固定长度的数组来存储这些条目。LoadPhoneBook和SavePhoneBook方法分别使用LoadFromTextFile和SaveToTextFile扩展方法来处理数据的持久化。
结论
ArrayIOExtensionsLib为C#开发人员提供了一种简单而强大的方法来管理数组数据的文件I/O操作。通过消除复杂的数据库设置需求,同时仍然允许有效的数据存储和检索,它特别适用于小型到中型的应用程序。
这个库的设计考虑到了易用性和灵活性,使得开发人员可以轻松地在各种场景中处理数组数据,包括处理null值和自定义对象类型。通过利用这个库,应用程序可以保持数据完整性并提供无缝的用户体验,同时保持代码的简洁和可维护性。
在未来的版本中,可能会考虑添加对动态调整数组大小的支持,以及更多的数据验证和错误处理功能,进一步增强库的功能和鲁棒性。
本文作者:技术老小子
本文链接:
版权声明:本博客所有文章除特别声明外,均采用 BY-NC-SA 许可协议。转载请注明出处!