请注意,本文编写于 225 天前,最后修改于 225 天前,其中某些信息可能已经过时。
目录
摘要
在C#中使用GDI+绘制贝塞尔曲线可以通过Graphics类的DrawBezier方法或者使用路径(GraphicsPath)对象然后添加贝塞尔曲线到路径中。如果想要添加多个贝塞尔曲线段,可以使用GraphicsPath对象的AddBezier或AddBeziers方法。这里,我们将通过AddBezier方法的使用来介绍如何绘制贝塞尔曲线。
正文
公式推导
对于一阶贝塞尔的话,最终得到的曲线还是一条直线,不过还是可以列一下通式方便后续推导:
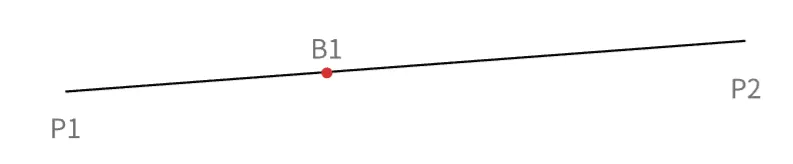
对上图,B1为一阶贝塞尔的点,则B1点随时间 t 的坐标为:
B1(t) = P1 + t * (P2 - P1) = (1 - t) * P1 + t * P2
二阶贝塞尔的话,与一阶贝塞尔是递归的关系,如下图:
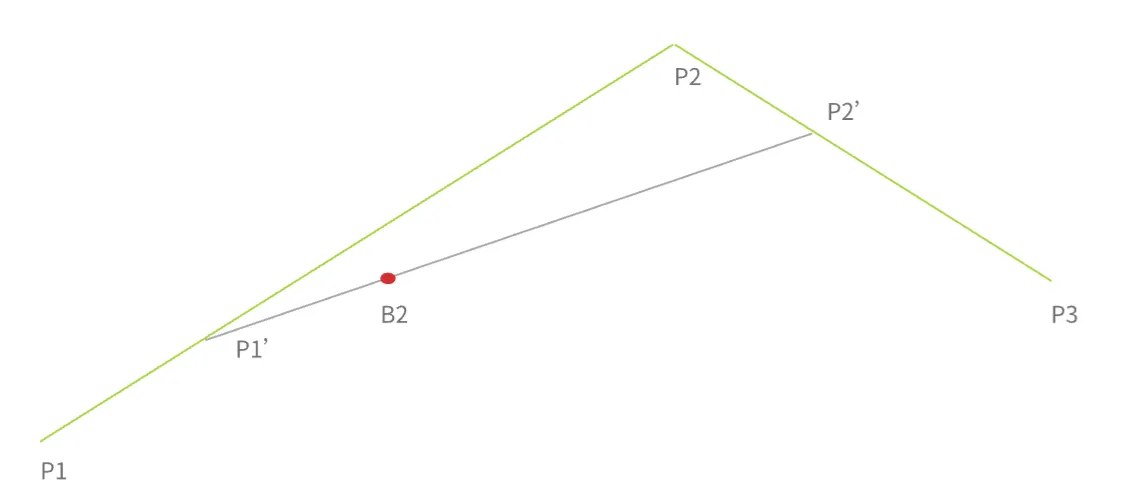
当达到时间t时,P1-P2线段上对应的一阶贝塞尔点移动到了P’的位置,P2-P3线段上的一阶贝塞尔点移动到了P2’的位置,此时在P1’-P2’线段上的t时刻的位置即为二阶贝塞尔此时的位置,即为图中B2的位置。B2的坐标点的计算公式为:
public void AddBezier (float x1, float y1, float x2, float y2, float x3, float y3, float x4, float y4);
参数
x1
曲线起始点的 X 坐标。
y1
曲线起始点的 Y 坐标。
x2
曲线第一个控制点的 X 坐标。
y2
曲线第一个控制点的 Y 坐标。
x3
曲线第二个控制点的 X 坐标。
y3
曲线第二个控制点的 Y 坐标。
x4
曲线终结点的 X 坐标。
y4
曲线终结点的 Y 坐标。
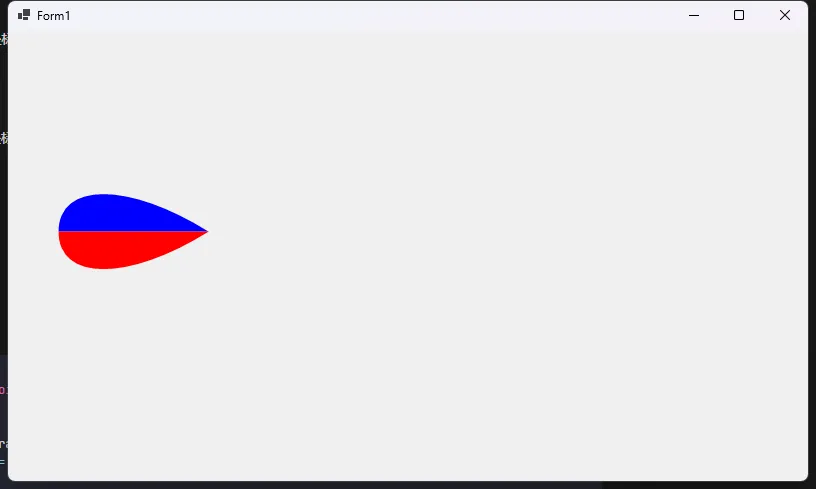
一个例子
C#protected override void OnPaint(PaintEventArgs e)
{
    base.OnPaint(e);
    Graphics g = e.Graphics;
    g.SmoothingMode = SmoothingMode.AntiAlias;


    Point p1 = new Point(50, 200);
    Point p2 = new Point(50, 150);
    Point p3 = new Point(120, 150);
    Point p4 = new Point(200, 200);

    Point p11 = new Point(50, 200);
    Point p22 = new Point(50, 250);
    Point p33 = new Point(120, 250);
    Point p44 = new Point(200, 200);

    GraphicsPath gp = new GraphicsPath();
    gp.AddBezier(p1, p2, p3, p4);
    gp.AddLine(p1, p4);
    g.FillPath(new SolidBrush(Color.Blue), gp);

    gp = new GraphicsPath();
    gp.AddBezier(p11, p22, p33, p44);
    gp.AddLine(p11, p44);
    g.FillPath(new SolidBrush(Color.Red), gp);

}
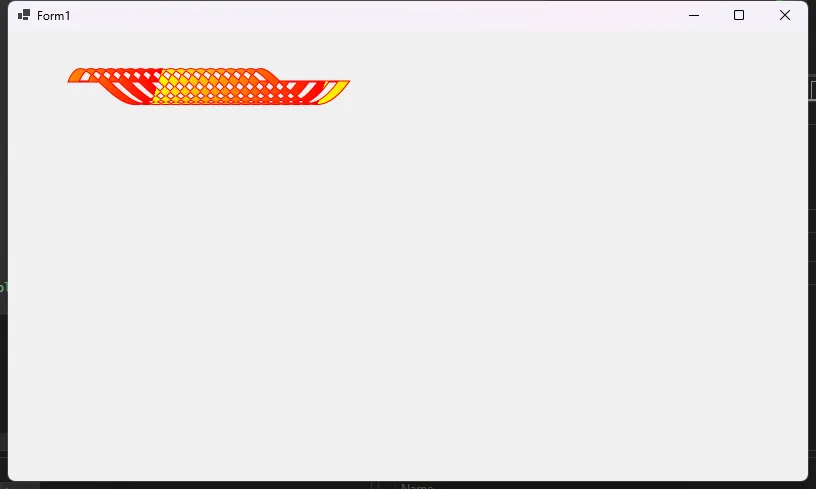
一个例子
C#protected override void OnPaint(PaintEventArgs e)
{
    base.OnPaint(e);
    Graphics g = e.Graphics;
    g.SmoothingMode = SmoothingMode.AntiAlias;

    // Create a new Path.
    GraphicsPath myPath = new GraphicsPath();

    // Call AddBezier.
    myPath.StartFigure();
    for (int i = 1; i < 20; i++)
    {
        myPath.AddBezier(50+i*10, 50, 70+i * 10, 0, 100 + i * 10, 120, 150 + i * 10, 50);
    }

    // Close the curve.
    myPath.CloseFigure();

    // Draw the path to screen.
    e.Graphics.DrawPath(new Pen(Color.Red, 2), myPath);

    e.Graphics.FillPath(new LinearGradientBrush(new Point(0,0),new Point(150,50),Color.Yellow,Color.Red),myPath);
}
本文作者:rick
本文链接:
版权声明:本博客所有文章除特别声明外,均采用 BY-NC-SA 许可协议。转载请注明出处!
目录