ML.NET 是什么?
ML.NET是一个由Microsoft开发的开源机器学习框架,它允许开发者在.NET环境中创建和使用机器学习模型。ML.NET的目标是使机器学习技术更加易于访问,同时也为.NET开发者提供一个强大的工具集来整合机器学习功能到他们的应用程序中。
ML.NET的主要特点包括
- 跨平台:ML.NET支持在Windows, macOS, 和Linux上运行,并且可以在不同的.NET实现上使用,包括.NET Core, .NET Framework, 和Xamarin。
- 易于使用:ML.NET提供了一个高级API用于创建和训练模型,这使得即使没有深厚的机器学习背景知识的开发者也能够使用机器学习算法。
- 灵活性和扩展性:开发者可以使用ML.NET内置的算法,也可以通过TensorFlow, ONNX (Open Neural Network Exchange), 和其他自定义模型来扩展ML.NET的功能。
- 集成到.NET应用程序:ML.NET允许开发者在他们熟悉的.NET环境中工作,这意味着可以使用C#或F#等语言,并且可以轻松地与现有的.NET代码库和数据源集成。
- 自动化机器学习(AutoML):ML.NET提供了Model Builder和CLI工具,这些工具可以自动化模型的选择和超参数调优过程,简化了机器学习工作流程。
- 多种机器学习任务:ML.NET支持多种机器学习任务,包括但不限于分类、回归、聚类、异常检测、推荐系统和自然语言处理等。
- 性能:ML.NET在性能上进行了优化,可以处理大规模数据,并且可以在生产环境中部署。
示例
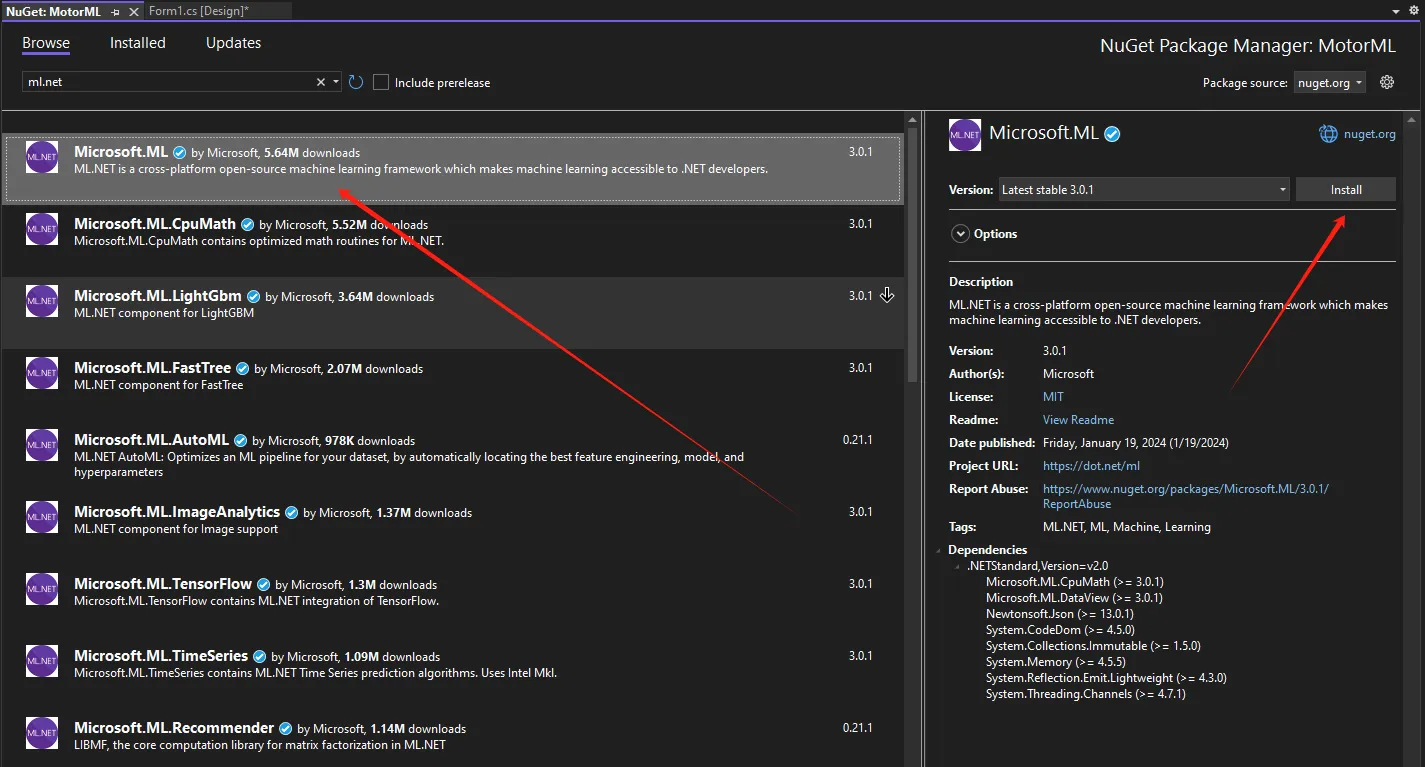
nuget 安装 ML.NET
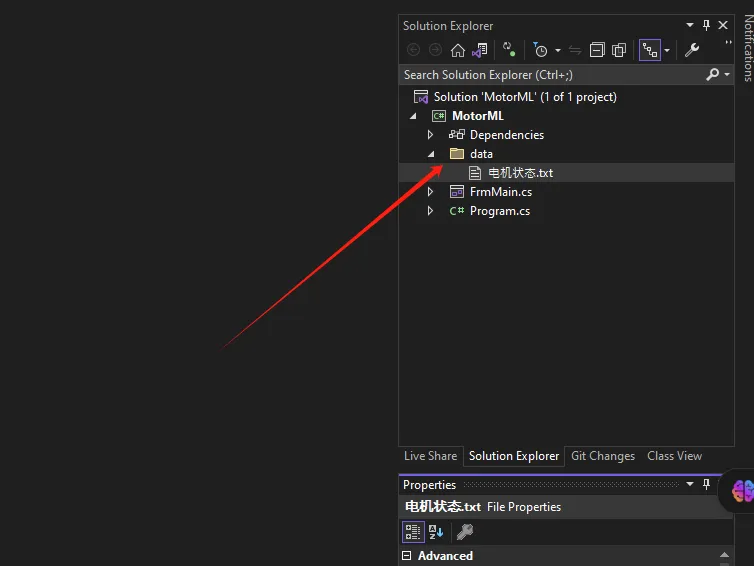
准备测试数据
加载测试数据

在Python开发过程中,尤其是数据分析和科学计算领域,我们经常需要处理大量的数组数据。想象一下,你花费了几个小时训练出的机器学习模型参数,或者经过复杂计算得到的分析结果,如果程序一关闭就全部丢失,那该有多心疼!
本文将深入解析NumPy数组的存储与加载技术,从基础的二进制存储到高级的压缩优化,帮你掌握数据持久化的核心技能。无论你是刚入门的Python开发者,还是需要处理大数据的工程师,这些实战技巧都将让你的开发效率翻倍提升。
🔍 问题分析:为什么需要数组持久化?
在实际的Python开发中,我们经常遇到以下场景:
📊 数据处理场景
- 科学计算:复杂的数值计算结果需要保存
- 机器学习:训练好的模型参数要持久化存储
- 数据分析:中间处理结果需要在不同程序间共享
- 上位机开发:传感器数据需要长期存储和分析
⚡ 性能考虑
相比于Python原生的pickle或JSON格式,NumPy提供的存储方案具有以下优势:
- 速度更快:二进制格式读写效率高
- 空间更省:专门针对数值数据优化
- 兼容性好:跨平台、跨版本兼容
💡 解决方案:NumPy存储方案全览
NumPy提供了多种数组存储方案,让我们逐一分析:
🎯 方案对比表
| 方法 | 适用场景 | 优点 | 缺点 |
|---|---|---|---|
save/load | 单个数组存储 | 简单快速 | 只能存储单个数组 |
savez/load | 多个数组存储 | 可存储多个数组 | 文件稍大 |
savez_compressed | 大数据存储 | 压缩比高 | 存取速度稍慢 |
savetxt/loadtxt | 文本格式需求 | 人类可读 | 精度损失,文件大 |
🛠️ 代码实战:从入门到精通
📁 基础存储:save() 和 load()
Pythonimport numpy as np
# 创建测试数据
data = np.random.rand(1000, 1000)
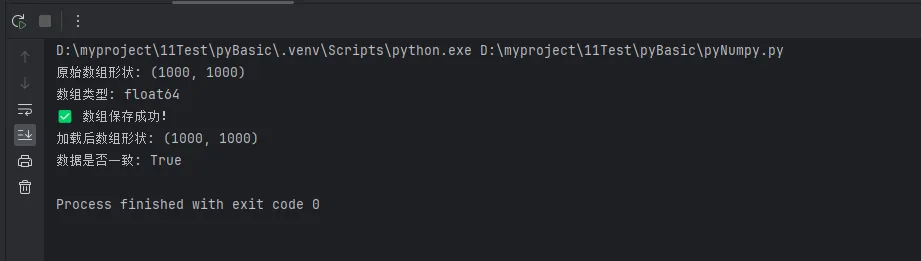
print(f"原始数组形状: {data.shape}")
print(f"数组类型: {data.dtype}")
# 保存数组到二进制文件
np.save('data.npy', data)
print("✅ 数组保存成功!")
# 加载数组
loaded_data = np.load('data.npy')
print(f"加载后数组形状: {loaded_data.shape}")
# 验证数据完整性
print(f"数据是否一致: {np.array_equal(data, loaded_data)}")
在数据科学和机器学习项目中,你是否经常需要生成测试数据、进行蒙特卡洛模拟,或者为算法提供随机初始值?作为Python开发者,掌握NumPy的随机数生成功能是必不可少的技能。本文将从实战角度出发,详细介绍NumPy随机数生成的各种应用场景,帮你解决日常开发中遇到的随机数据生成难题。无论你是在做数据分析、机器学习模型训练,还是上位机开发中的数据模拟,这篇文章都将为你提供完整的解决方案。
🔍 随机数生成的核心问题分析
传统random模块的局限性
在Python开发中,很多初学者习惯使用内置的random模块,但在处理大规模数据时会遇到以下问题:
性能瓶颈:Python原生random模块基于单个数值生成,处理大量数据时效率低下
功能限制:缺乏对多维数组的直接支持,无法快速生成复杂的数据结构
科学计算不足:缺少常用的概率分布函数,难以满足统计分析需求
NumPy随机数生成的优势
NumPy的numpy.random模块专为数值计算和科学计算设计,具有以下核心优势:
- 向量化操作:一次生成大量随机数,性能提升显著
- 丰富的分布函数:支持30+种概率分布
- 多维数组支持:直接生成任意维度的随机数组
- 可重现性:通过随机种子确保结果可复现
💡 NumPy随机数生成完整解决方案
🌟 基础随机数生成
1. 均匀分布随机数
Pythonimport numpy as np
# 设置随机种子,确保结果可重现
np.random.seed(42)
# 生成0-1之间的随机数
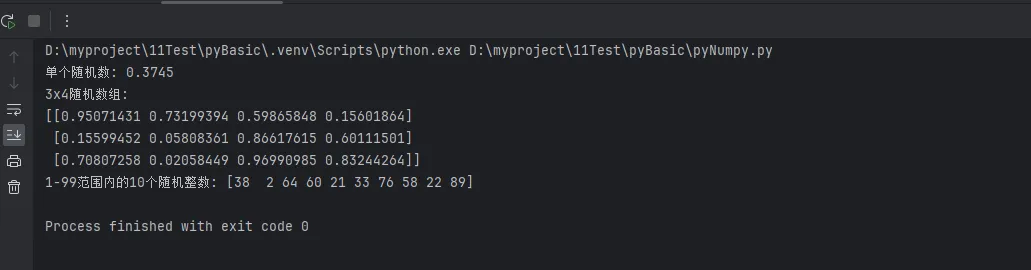
random_float = np.random.random()
print(f"单个随机数: {random_float:.4f}")
# 生成指定形状的随机数组
random_array = np.random.random((3, 4))
print(f"3x4随机数组:\n{random_array}")
# 生成指定范围的随机整数
random_ints = np.random.randint(1, 100, size=10)
print(f"1-99范围内的10个随机整数: {random_ints}")
2. 指定范围的随机数
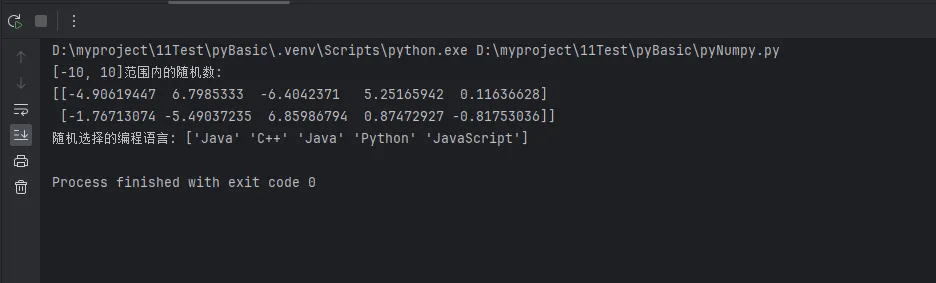
Python# uniform函数:生成指定范围的均匀分布
uniform_data = np.random.uniform(low=-10, high=10, size=(2, 5))
print(f"[-10, 10]范围内的随机数:\n{uniform_data}")

# choice函数:从数组中随机选择
choices = np.random.choice(['Python', 'Java', 'C++', 'JavaScript'],
                          size=5, replace=True)
print(f"随机选择的编程语言: {choices}")
你是否在Python开发中遇到过这样的困扰:不同形状的数组无法直接进行运算?或者为了让两个数组能够相加,不得不写大量的循环代码?今天我们就来深入解析NumPy的数组广播机制,这个被誉为NumPy最强大特性之一的功能,将彻底改变你处理数值计算的方式。
广播机制不仅能让你告别繁琐的循环代码,更能让你的程序运行速度提升数倍。无论你是刚接触NumPy的新手,还是想要优化代码性能的资深开发者,掌握广播机制都将让你的Python开发技能更上一层楼。
🔍 问题分析:为什么需要数组广播?
传统方法的痛点
在没有广播机制之前,我们处理不同形状数组的运算时,往往需要手动扩展数组或使用循环:
Pythonimport numpy as np
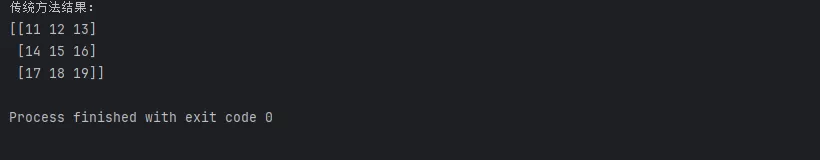
# 传统方法:手动循环处理
matrix = np.array([[1, 2, 3],
[4, 5, 6],
[7, 8, 9]])
scalar = 10
# 错误的做法:需要手动循环
result = np.zeros_like(matrix)
for i in range(matrix.shape[0]):
for j in range(matrix.shape[1]):
result[i, j] = matrix[i, j] + scalar
print("传统方法结果:")
print(result)
在Python开发中,特别是上位机开发和数据分析领域,线性代数运算是不可避免的核心技能。无论你是在处理传感器数据、图像处理,还是机器学习算法,NumPy的线性代数功能都能让你的代码更高效、更专业。
本文将从实战角度出发,详细解析Python NumPy中的线性代数运算,帮助你掌握从基础矩阵操作到高级数值计算的全套技能。我们不仅会讲解理论知识,更重要的是提供大量可直接应用于实际项目的编程技巧和最佳实践。
🔍 问题分析:为什么选择NumPy进行线性代数运算?
💪 性能优势
NumPy底层使用C语言实现,相比纯Python代码,运算速度提升10-100倍:
Pythonimport numpy as np
import time
# 纯Python矩阵乘法
def python_matrix_multiply(A, B):
rows_A, cols_A = len(A), len(A[0])
rows_B, cols_B = len(B), len(B[0])
result = [[0 for _ in range(cols_B)] for _ in range(rows_A)]
for i in range(rows_A):
for j in range(cols_B):
for k in range(cols_A):
result[i][j] += A[i][k] * B[k][j]
return result
# 测试数据
size = 500
A_py = [[1 for _ in range(size)] for _ in range(size)]
B_py = [[2 for _ in range(size)] for _ in range(size)]
A_np = np.ones((size, size))
B_np = np.ones((size, size)) * 2
# 性能对比
start = time.time()
result_py = python_matrix_multiply(A_py, B_py)
python_time = time.time() - start
start = time.time()
result_np = np.dot(A_np, B_np)
numpy_time = time.time() - start
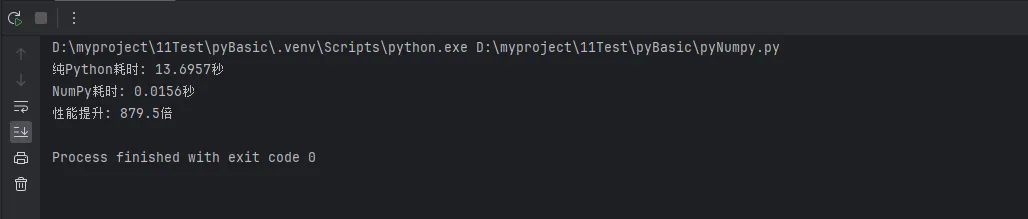
print(f"纯Python耗时: {python_time:.4f}秒")
print(f"NumPy耗时: {numpy_time:.4f}秒")
print(f"性能提升: {python_time/numpy_time:.1f}倍")